What Is a Website Heatmap?
Learn how a website heatmap groups clicks, scrolls, or page areas, what its colors can show, and why the map needs privacy checks and context.

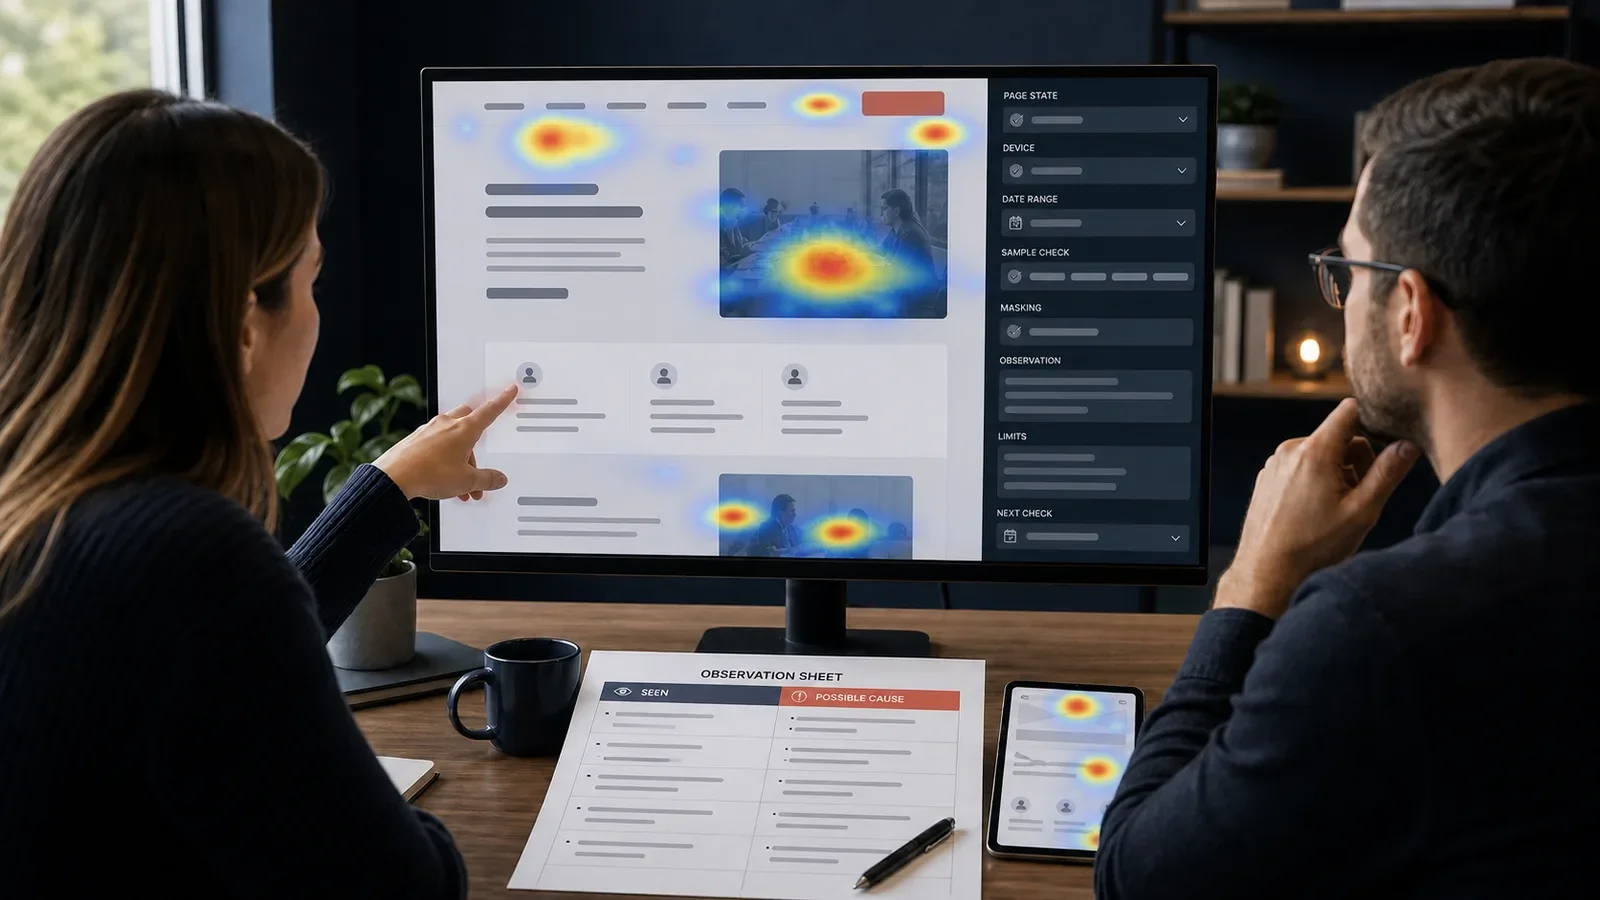
A website heatmap is a picture that groups tracked actions. A color layer sits over a page to show where clicks, taps, scroll reach, or use of a page area is more or less common.
The map is built from tracked events and one view of the page. It is not a film of every visit. It does not show what a person thought or prove that one page part caused a result.
Put It in Plain Words
A tool groups many recorded actions and draws a color layer over a page. Warmer areas usually mean more of the selected event under that tool’s scale.
A click map and a scroll map answer different questions. The legend, filter, device, page group, and event must be named.
Responsive pages change shape. Desktop, tablet, and mobile actions should not be placed on one screenshot without a sound mapping method.
Dynamic menus, tests, personalized areas, consent states, and logged-in views can make the overlay differ from what people saw.
A hot area can be useful, expected, confusing, or accidental. The image alone cannot explain why someone acted.
A cold area can mean low interest, low visibility, an irrelevant task, a blocked control, or simply a small sample.
Set the analysis question before opening the map. Ask about one page, state, group, period, and task.
Confirm tracking, masking, consent, retention, access, and exclusion rules. Do not collect sensitive content because the tool can.
Check the sample and denominator. A few sessions can create a bold-looking image with weak evidence.
Inspect the page state used for the overlay. Make sure the current page still matches the tracked period.
Pair the map with accessibility testing, analytics, support reports, and direct research. Each source can challenge the others.
Write observations before explanations. “The form label received few clicks” is an observation; “people did not trust it” is a guess.
Choose a safe next check. Fix an obvious defect, review recordings where allowed, run usability research, or design a bounded test.
Keep screenshots out of public decks when they may expose private page content, account data, or individual behavior.
How Does Website Heatmap Work?
A tag or app records a chosen set of page events. The tool groups them by page, link, area, screen size, device, and filter. It then draws a color scale on a sample page view.
The reviewer names the question and user group. They check the page view and sample, note the limits, and use one more source of proof before they choose a change.
Why Is It Important?
A heatmap can make a large set of page events quick to scan. It can point the team toward a link, form, scroll, or tracking question.
The bright picture can feel more sure than it is. Bad grouping, wrong page views, weak consent, and a poor reading of the map can turn color into a false story.
Where Is It Used?
Menus, forms, calls to action, long pages, page order, and screen checks.
Phone and desktop checks, release review, and plans for user study.
A first review of clues when privacy, access, masking, and data-life rules are in place.
A Simple Website Heatmap Example
A support page’s click map shows many recorded clicks on a heading that is not interactive. The team first checks whether the event mapping and screenshot are correct.
If the pattern remains, it reviews the page with users and may test a clearer link or remove misleading styling. The map suggests a question; it does not prove the cause.
What Should a Heatmap Review Record?
Question, page, page state, device, and date range.
Map type, event rule, color scale, and total used.
Filters, consent, masking, access, and data life.
Sample size, page changes, and known tool limits.
What the team saw, kept apart from why it may have happened.
Other proof, owner, next check, and stop rule.
How Do You Analyze a Heatmap?
Define one question and eligible page state.
Verify collection, consent, masking, and sample.
Choose the correct map and filters.
Record observations without assigning motives.
Compare analytics, research, defects, and access.
Run the smallest safe next check.
Heatmap vs. Session Recording
A heatmap aggregates selected events across sessions. A session recording reconstructs the sequence of events from one session. The heatmap shows a pattern; the recording shows one path.
Neither method reveals a person’s thoughts. Both can be affected by missing events, page state, device behavior, consent, sampling, masking, and tool rules.
Common Mistakes
Reading warm color as proof of success.
Combining incompatible devices or page states.
Ignoring consent, masking, and sensitive fields.
Explaining behavior without user evidence.
Changing a page before checking tracking and sample quality.
Frequently Asked Questions
Do heatmaps track eye movement?
Ordinary website click and scroll heatmaps do not directly track eyes. Some products estimate attention, while true eye-tracking uses different equipment and methods.
How much traffic does a heatmap need?
There is no universal count. It depends on the question, event, page variation, filters, and how much uncertainty the decision can tolerate.
Are heatmaps personal data?
The legal and privacy answer depends on the events, identifiers, content, jurisdiction, purpose, consent, contracts, and controls. Complete a real privacy review before collection.
Use Website Conversion Rate Optimization for the broader diagnosis and A/B Testing Is Not a Silver Bullet before turning a visual pattern into an experiment claim.
Need a behavior review that separates what the tool recorded from what the team assumes?
Book a free Brand and Tech Assessment to map the current problem, evidence, constraints, and practical next step.
Sources
- Microsoft Learn: Heatmaps overview in Clarity. https://learn.microsoft.com/en-us/clarity/heatmaps/heatmaps-overview
- Microsoft Learn: Clarity data and privacy documentation. https://learn.microsoft.com/en-us/clarity/setup-and-installation/clarity-data